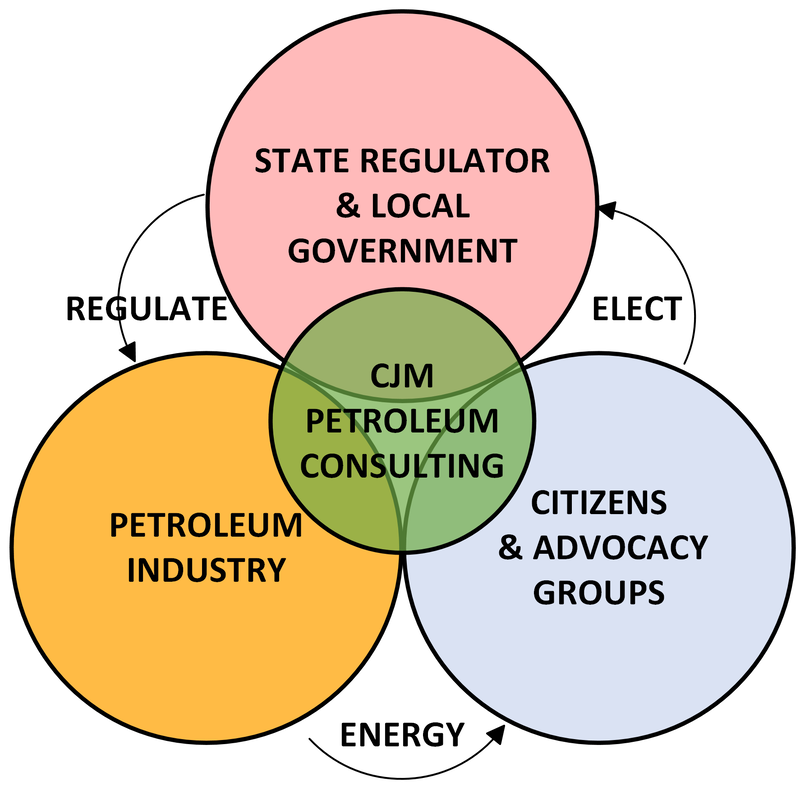
Supporting California’s transition to clean energy by encouraging cooperation and collaboration in pursuit of responsible, efficient, and methodical oilfield asset retirement acceleration, evaluation, planning, and execution.
Fostering success through the pursuit of alliances over discord.
Fostering success through the pursuit of alliances over discord.

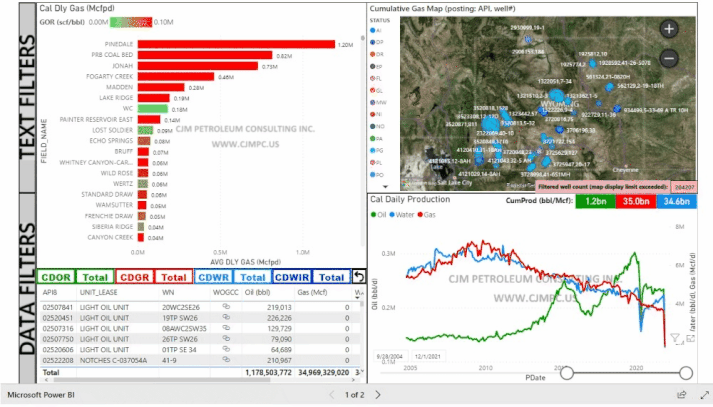
EVALUATEWant all well data in one place? Our dashboards enhance asset evaluation through improved visualization of public well data including geospatial and volumetric activity. We want to help improve analytical processes, boost query efficiency, and promote evidence-based decisions.
|
|
|
OPTIMIZECan we benefit the environment and reduce cost? Yes! Optimizing existing assets can benefit both by avoiding costly expansion projects allowing focus on improving performance of existing, and retirement of dispensable, assets. Our tools assist to identify areas of underperformance that already have infrastructure in place, enabling targeted improvements.
|
EVOVLE UNITED
We're here to help! CJM Petroleum Consulting encourages the use our dashboards to identify and prioritize wells for closure that are economically unviable and no longer aligned with our energy objectives. We offer professionally-licensed engineering consulting services to assist in optimization of existing assets and selection, planning, permitting, and execution of regulatory-compliant well abandonments.